June Total Capital Goods New Orders Highest in 2014
However, the month-over-month rate of change was -6.9%. This is the second month in a row of contraction.
According to the Census Bureau, real capital goods new orders in June 2014 were $104,218 million. Although this is the highest monthly total of 2014, the month-over-month rate of change was -6.9%. This is the second month in a row of contraction, and it is the fifth time in seven months that the month-over-month rate of change has contracted. The annual rate of change has been growing for 11 consecutive months. However, the rate of growth has decelerated the last two months. The annual rate of growth is now at its slowest rate since August 2013.
This leading indicator is now negative for future capital spending. Total capital goods new orders tend to lead industrial production by three months and capital spending by 18 months on average based on long-term historical correlations. Since it appears that total capital goods new orders peaked two months ago, the annual rate of change in industrial production should be expected to peak any month now based on this leading indicator alone.
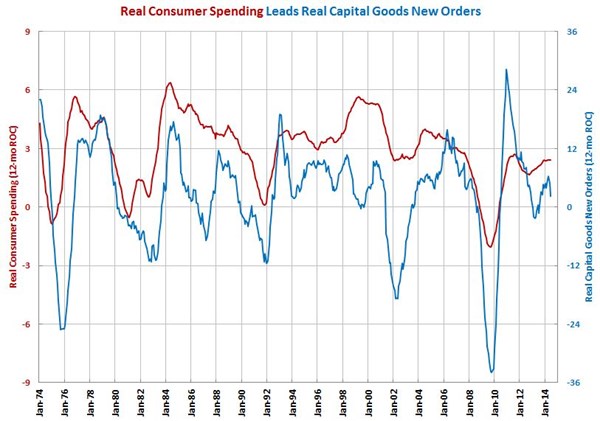
A good leading indicator for real capital goods new orders is real consumer spending. Since October 2013, the annual rate of change in real consumer spending has been virtually unchanged. Unless the rate of growth in real consumer spending accelerates it is likely that there will be further slowing in total capital goods new orders.
We use real capital goods new orders to forecast activity in metalcutting job shops, metalworking, and durable goods.


.JPG;width=70;height=70;mode=crop)