Growth in Construction Spending Sets Record
Which beat the record of fastest growth from last month.
The value of construction put in place in July 2015 was $98,987 (millions of real dollars). Compared with one year ago, spending in July was up 22.2 percent. This was the fastest rate of month-over-month growth in the history of the dataset, which goes back to 1970. The month-over-month rate of growth has accelerated rapidly since August 2014. The annual rate of change is now 10.8 percent, which is the fastest rate of annual growth since June 1999. In the previous two economic cycles, the peak rate of annual growth in construction spending occurred two to four years before the stock market bubble burst. Obviously, the peak in construction spending was closer to the peak in actual economic growth.
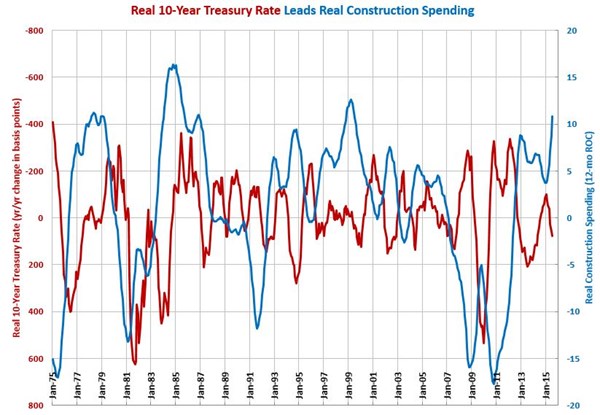
With the Fed dithering on raising interest rates because of weak wage growth, weak GDP, fear of a falling stock market, government interest payments, or whatever reason, another major bubble is being built in construction spending. The bubble in construction spending is happening as consumers are already starting to slow their spending, which means the revenue may not be there to support all of the construction loans. Of course, the market may take care of this problem on its own as the real 10-year treasury rate is already rising year over year. Based on the chart velow, a rising 10-year treasury rate (the red line below zero - a positive number - on this chart) always leads to a significant drop in the rate of change in construction spending (althought not necessarily a contraction).
Real construction spending is a good leading indicator for construction materials, hardware, and HVAC industrial production.


.JPG;width=70;height=70;mode=crop)