Capital Goods Orders Contract for 8th Month in a Row
Unless there is a major surprise next month, the annual rate of change will fall into contraction.
Real capital goods new orders in June 2015 were $101,902 million. This was just the second time that capital goods new orders were above $100,000 million in 2015. However, compared with one year ago, capital goods new orders were down 4.7 percent. This was the eighth month in a row that the month-over-month rate of change contracted. The annual rate of change managed to tick up a couple of points to 2.0 percent. But, the general trend in the annual rate of change is decelerating growth. And, unless orders hit $182,000 million next month, which would be far and away the largest monthly new order total ever, then the annual rate of change will start to contract next month. In fact, capital goods new orders in July have been above $100,000 million only one time in history. If capital goods new orders were $100,000 million, then the annual rate of change would drop to -7.0 percent. That would be the lowest annual rate of change since May 2010.
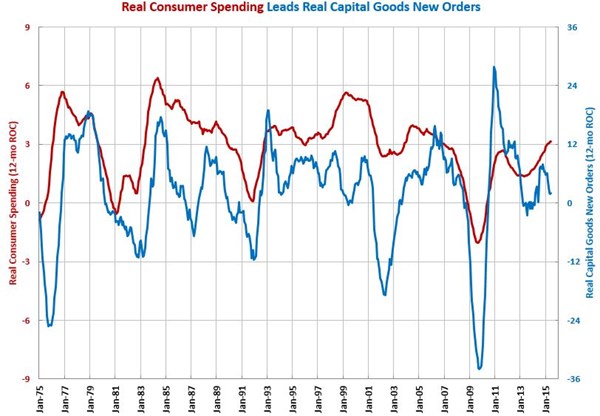
A good leading indicator for real capital goods new orders is real consumer spending. The most recent month saw the rate of change slow noticeably. The annual rate of change in total consumer spending has been accelerating though. At this time it appears that consumer spending is pointing to weaker capital goods new orders.
We use real capital goods new orders to forecast activity in metalcutting job shops, metalworking, and durable goods.


.JPG;width=70;height=70;mode=crop)