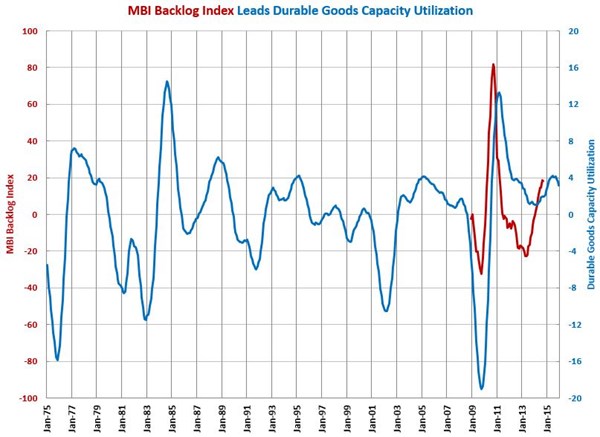
Durable Goods Capacity Utilization above 77% Last Five Months
Durable goods capacity utilization has been growing at an accelerating rate annually, which is indication of increased capital spending in 2015.
According to the Federal Reserve, durable goods capacity utilization was 77.6% in September 2014. The month-over-month rate of change was 2.0%, which was the fifth straight month that the growth rate was above 2.0%. The annual rate of change remained steady at 1.9% for the third month in a row. This is virtually double the annual rate of growth recorded in March 2014. This is the fastest rate of annual growth since May 2013.
Since June 2008, the Gardner Business Index backlog index has been a very good leading indicator of durable goods capacity utilization. Our backlog index grew at a slightly slower rate in September, but the rate of growth is still quite strong. The trend in the backlog index is pointing towards a rapid increase in durable goods capacity utilization for the remainder of 2014 and the early part of 2015. My forecast calls for durable goods capacity utilization to reach 80% in December and remain above that level through July 2015.
We use capacity utilization as a leading indicator for a number of industries, although it is not tracked for as many industries as industrial production. You can see the trends in capacity utilization for a number of industries below.
Accelerating Growth: aerospace; custom processors; durable goods; forming/fabricating (non-auto); furniture; machinery/equipment; petrochemical processors; plastics/rubber products; primary metals; printing; textiles/clothing/leather goods
Decelerating Growth: automotive; construction materials; wood/paper
Accelerating Contraction: electronics/computers/telecommunications
Decelerating Contraction: food/beverage processing


.JPG;width=70;height=70;mode=crop)
