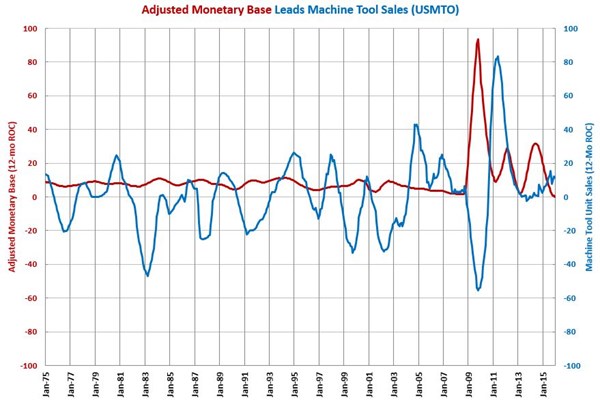
Monetary Base Jumps $100 Billion to End 2014
As QE ended, the monetary base fell nearly $200 billion in October and November. But, it jumped back up nearly $100 billion in December.
In December 2014, the monetary base was $3.953 trillion dollars. That is 5.8% more than it was in December 2013. This ended a sttring of 11 consecutive months of decelerating growth in the month-over-month rate of change. However, the annual rate of change decelerated for the sixth month in a row. The annual rate of change is growing at its slowest rate since November 2013. Since the end of QE, there have been some wild swings in the monetary base. October and November saw a combined of roughly $220 billion while December saw an increase of nearly $100 billion. These are some of the largest monthly swings since the financial crisis began.
Historically, changes in the monetary base lead changes in capital equipment spending by about two years. Therefore, the money supply is pointing to strong growth in machine tool consumption in 2015. Based on the trend in money supply, the peak rate of growth in capital equipment spending should occur in late 2015 or early 2016. Then, capital equipment spending likely contract in 2016 and possibly in 2017. But, this is based on just one leading indicator. You can see how the monetary base leads various machine tool sales and consumption data as well as primary plastics processing equipment at our monetary page.
The real 10-year treasury rate is a good leading indicator for the adjusted monetary base. Historically, changes in the real 10-year treasury rate have led changes in the monetary base by about 15 months. This is because banks increase their lending due to lower rates that leads to increased deposits that then lead to a need for increased reserves. (Yes, this is the opposite of what many of us think happens - which is that banks increase their deposits and then lend those deposits.) From early 2012 to the middle of 2013, the 10-year treasury was increasing at a rapid rate. I think this will correspond to a significantly slower rate of growth in the monetary base from June 2014 until sometime in the first half of 2015 (or, however long the Fed will be able to stand a shrinking economy in terms of GDP and perhaps a falling stock market).
Also, the U.S. dollar major exchange rate (the USD compared to the other six major currencies of the world) and the U.S. dollar broad exchange rate (the USD compared to all world currencies) appear to be good leading indicators of the U.S. monetary base. The US dollar against the other major currencies of the world is growing at an accelerating rate. However, the overall trend since the beginning of 2013 is for slower growth in the U.S. dollar. This indicates slower growth in the monetary base. However, the U.S. dollar against all currencies is pointing to faster growth in the monetary base as it has been growing faster and faster since the spring of 2013.
On a related note, it's probably not a coincidence that the price of oil has taken a huge plunge since QE was ended.


.JPG;width=70;height=70;mode=crop)