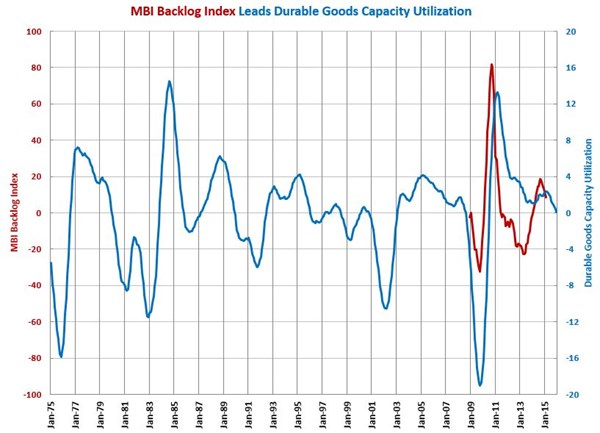
Capacity Utilization Growth Rate Slowest since February 2014
Capacity utilization reached its peak level in July 2014 due to strength in the automotive industry.
Durable goods capacity utilization was 76.9% in February 2015. The month-over-month rate of change was 0.7%, which was the 13th straight month of month-over-month growth. However, this was the slowest rate of month-over-month growth since February 2014. The annual rate of growth decelerated slightly from last month. The annual rate of growht is still noticeably faster than it was in 2014 though.
Since June 2008, the Gardner Business Index backlog index has been a very good leading indicator of durable goods capacity utilization. Our backlog index has grown at a slower rate the last five months. The trend in the backlog index shows that capacity utilization has likely seen its peak rate of growth.
We use capacity utilization as a leading indicator for a number of industries, although it is not tracked for as many industries as industrial production. You can see the trends in capacity utilization for a number of industries below.
Accelerating Growth: aerospace; construction materials; custom processors; food/beverage processing; forming/fabricating (non-auto); furniture; petrochemical processors; plastics/rubber products; textiles/clothing/leather goods; wood/paper
Decelerating Growth: automotive; durable goods; machinery/equipment; primary metals; printing
Accelerating Contraction: electronics/computers/telecommunications
Decelerating Contraction: none


.JPG;width=70;height=70;mode=crop)